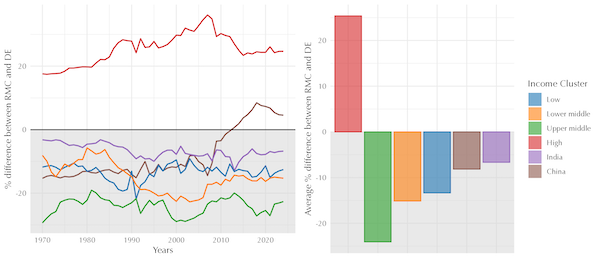
From 1970 to 2024, global resource extraction surged from 31 to 106 gigatons, with about 30 percent consistently tied to traded goods. This growth is marked by stark inequalities and a zero-sum dynamic: more resources flowing to high-income countries means fewer for low-income ones. Based on data tracking traded raw materials and their embodiment as Raw Material Equivalents (RMEs) in (semi-)finished products, the group of high-income countries is the only one with cumulative net imports, totalling 290 Gt. All other income groups were net exporters, with low-income countries collectively exporting 9.6 Gt. The graph here adds an important nuance: while their exports are the smallest in absolute terms, the drain is significant relative to what they extract. As a group, low-income countries consumed 13.3 percent less than they extracted, sending the rest to global markets. Meanwhile, high-income countries consumed 24.1 percent more than they extracted, bridging the gap with imports.
Leave a Reply