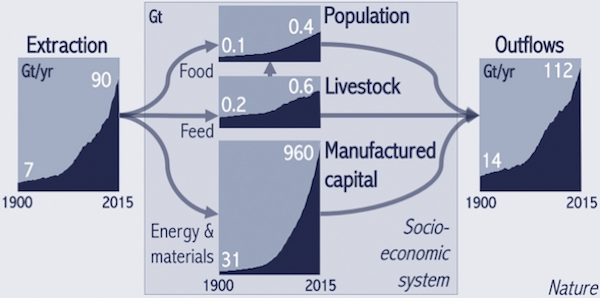
A Mount Everest every 20 months

In 2015, global production systems used 90 gigatonnes (billion tonnes) of natural resources and discarded 112 gigatonnes as waste and energy. To put this in perspective, the world economy processes resources equivalent to an entire Mount Everest every 20 months. This is a result of an expanding process. The global economy involves the inflow, outflow, and accumulation of resources, all of which are experiencing exponential growth as you can see from the graph. Looking ahead, the United Nations Environmental Programme projects resource consumption to reach 184 Gt per year by 2050 in a business-as-usual scenario. This means a Mount Everest of resources every 10 months! Even under a high-efficiency scenario, resource consumption is expected to rise to 132 Gt per year by 2050, representing a 43% increase from the current level.

Source: Krausmann, F., Lauk, C., Haas, W., & Wiedenhofer, D. (2018). From resource extraction to outflows of wastes and emissions: The socioeconomic metabolism of the global economy, 1900–2015. Global environmental change, 52, 131-140.

Running out of metals

The “green transition” is not green. Mining for essential minerals already inflicts significant environmental damage, and this damage will likely increase as extraction rates lag behind what is needed. For example, we need approximately 4.6 billion tonnes of copper to replace just one generation of renewable energy infrastructure. However, the current annual production is only around 24 million tonnes. At this rate, it would take about 190 years to achieve the necessary copper supply, which would require a significant increase in production and its associated environmental consequences. Compounding the issue, global copper reserves currently stand at about 880 million tonnes, enough for only 30 more years of production, covering just 19% of the requirement for one generation of renewable infrastructure. The situation is even more dire for other critical metals. While copper recycling rates are relatively high, they are insufficient for many other essential metals. The reference below delves deeper into these critical limitations.

Source: Michaux, S. (2022) The quantity of metals required to manufacture just one generation of renewable technology to phase out fossil fuels. JKMRC Friday Seminars 2022.

Under the floor or above the ceiling

We must avoid overshooting environmental ceilings (climate, biodiversity, etc.) while ensuring we meet social floors (food, education, etc.). But who constitutes “we”? This graph illustrates the average extent to which ceilings are overshot (horizontal axis) and floors are achieved (vertical axis). Ideally, countries would reside in the top left corner, above the floors and below the ceilings. Circles depict performance at the end of the analysis period, with paths indicating their starting points and sizes varying according to population. Global North countries fall into the low social shortfall and high ecological overshoot group, increasing their ecological overshoot to 350% beyond fair shares of the ecological ceiling on average. Meanwhile, global South countries in the high social shortfall and low ecological overshoot group show an ecological overshoot of 19%, on average. Although no countries eliminate shortfalls without overshooting ceilings, the encouraging news is that several countries manage promising trajectories, such as Costa Rica, Jordan, Albania, and Mauritius. How do they achieve this balance?

Source: Fanning, A. L., O’Neill, D. W., Hickel, J., & Roux, N. (2022). The social shortfall and ecological overshoot of nations. Nature sustainability, 5(1), 26-36.

How rich countries drain the world

How can a wealthy country increase its material wealth at the expense of a less wealthy country without resorting to genocide and plunder? By forming trade alliances under the guise of economic cooperation and mutual benefit. Sounds far-fetched? High-income countries (HICs) consistently import far more materials, energy, land, and labour than they export. For instance, from 1990 to 2015, HICs accumulated 215 billion tons of raw materials beyond their domestic extraction capabilities. In contrast, low-income countries (LICs) and lower-middle-income countries (LMICs), including India, net-exported nearly 90 billion tons of raw materials during the same period. Moreover, HICs not only drain resources but also underpay, as shown by the last graph (TiVA). Traditional trade accounts suggest a simple exchange of money for resources, but in reality, both material and monetary gains flow in the same direction—towards the HICs.

Source: Dorninger, C., Hornborg, A., Abson, D. J., Von Wehrden, H., Schaffartzik, A., Giljum, S., … & Wieland, H. (2021). Global patterns of ecologically unequal exchange: Implications for sustainability in the 21st century. Ecological economics, 179, 106824.