Who’s breaching the planetary boundaries?

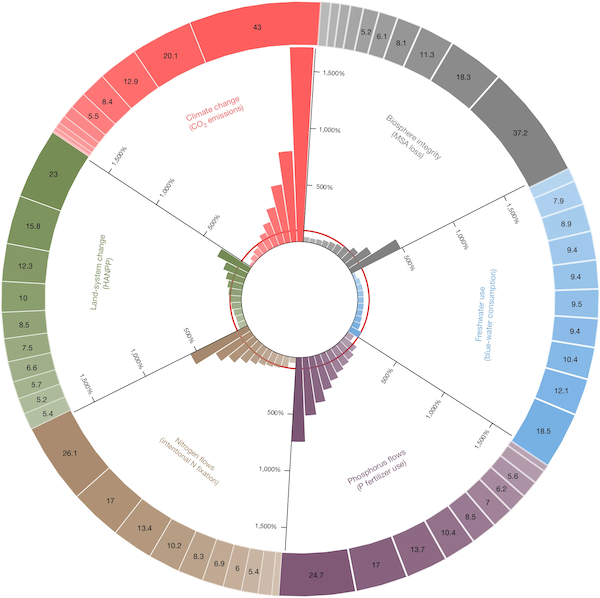
Rampant consumption, unsustainable production, and unchecked resource extraction have driven the planet beyond the stable conditions of the Holocene, breaching critical planetary boundaries. Who bears the responsibility? While the capitalist supply system is undoubtedly a key driver, the wealthiest populations disproportionately contribute to this crisis: in 2017, the richest 10% of global consumers were responsible for 43% of carbon emissions, 23% of land-system changes, 26.1% of nitrogen fixation, 24.7% of phosphorus use, 18.5% of water consumption, and 37.2% of biodiversity loss. In contrast, the poorest 10% contributed less than 5.4% across any of these metrics. Per capita, the richest 10% imposed environmental burdens 4.2 to 77 times greater than those of the poorest. The inequality points to a logical solution: if the top 20% reduced their consumption to the lowest levels within their group, global environmental pressures could decrease by 25–53%. Addressing consumption patterns in food and services alone could reverse critical land-system changes and biodiversity loss, bringing these measures back within safe planetary limits.

Source: Tian, P., Zhong, H., Chen, X., Feng, K., Sun, L., Zhang, N., … & Hubacek, K. (2024). Keeping the global consumption within the planetary boundaries. Nature, 1-6.

The World’s priorities

The Global South isn’t disappearing—it’s increasingly global, as seen in widening income gaps, entrenched poverty, and the ongoing extraction of resources and labour-power toward the global North. This reflects a five-century-long expansion of capitalism, which dictates global priorities in investment, production, and consumption. These choices are shaped by powerful states, global institutions, corporations, and an affluent minority. The outcome? A global spending pattern that that all but prioritises the poor as shown in this graph. For instance, funding for universal basic education falls short of U.S. cosmetic spending alone, and ensuring water and sanitation for all costs less than Europe’s annual ice cream purchases. The numbers are from the late 1990s, but the message endures.

Source: Thomas, C. (1999). Where is the Third World now? Review of International Studies 25(5): 225-244.

Skyrocketing Income Inequality

Mainstream trade theories might claim that trade growth narrows economic gaps, but the numbers tell a different story. From 1950 to 2022, per capita GDP in low-income countries (LICs) rose by 42%, while high-income countries (HICs) surged by 385%—and that’s just scratching the surface. Accounting for within-country inequality, things look even worse: in 2022, the poorest 50% of people globally took home only 10% of total income, while the richest 10% pocketed around 44%. Even starker, the richest 1% earned nearly as much as the entire bottom half combined. Since 1950, the richest 10% saw income growth 19.6 times greater than the bottom 50%, and the richest 1% saw growth 48.2 times larger. Inequality hasn’t just grown; it’s skyrocketed.

Based on: UNU-WIDER (2023) World Income Inequality Database (WIID) Companion dataset (wiidcountry and/or wiidglobal). Version 28 November 2023. https://doi.org/10.35188/UNU-WIDER/WIIDcomp-281123

How price gaps drive resource drains

Global North countries tend to drain resources from the rest of the world—a process called ecological unequal exchange. Also, the more a country is drained, the less it gets paid, measured in value-added per ton (unless the drained country is a global North country). So why do these imbalances persist? Shouldn’t prices eventually adjust, as mainstream economics suggests? This study shows the global monetary system is largely to blame. Global North countries have higher “price levels,” which reflect differences in the value of currencies—more precisely, differences between market exchange (ME) rates, and Purchasing Power Parity (PPP) exchange rates which compare currencies based on living costs. Economists expect these two rates to align in competitive markets. However, for global South countries, the ME rate is persistently lower than the PPP rate (e.g., 1$:74₹ and 1$:23₹ for India in 2021), and the price level (ME divided by PPP rate) is therefore lower too. This graph shows that the North-South price level gap is linked to ecological unequal exchange. Higher price levels correlate with higher value-added per resource exported as well as with greater net-imports of resources. While some correlations, like those for land and energy imports, aren’t statistically significant, the patterns are strong for labour, raw materials, and the overall monetary value of resources. This suggests that ecological unequal exchange represent the combination of material and monetary imbalances between North and South.

Source: Olk, C. (2024). How much a dollar cost: Currency hierarchy as a driver of ecologically unequal exchange. World Development, 180, 106649.

Decent living gaps

In recent years, defining “decent living standards” (DLS)—the basics for human well-being—has gained attention. This study examines the shortfalls in providing decent health, shelter, nutrition, socialisation, and mobility worldwide. The gaps are stark: in sub-Saharan Africa, over 60% of people fail to meet DLS levels on more than half of the basic needs, like housing, sanitation, and water access. South and Pacific Asia face similar issues, with additional struggles in clean cooking and heating. This study also reveals that in all countries of the global South, DLS shortfalls far outstrip income poverty rates, even at slightly more realistic poverty thresholds.

Source: Kikstra, J. S., Mastrucci, A., Min, J., Riahi, K., & Rao, N. D. (2021). Decent living gaps and energy needs around the world. Environmental Research Letters, 16(9), 095006.

European Green Deal’s ecological spillovers

The European Green Deal’s (EGD) push to cut carbon emissions and restore ecosystems is NOT green. Not only will it contribute to the global rush on limited metals, but it could also trigger major environmental damage outside the EU. By 2030, the EGD’s agriculture and forestry goals would increase demand for 23.9 million hectares of farmland outside the EU (on top of existing land claims outside the EU). This would lead to a staggering rise in CO2 emissions—about 758.9 million tons—equivalent to 245% of the EGD’s carbon reduction target for land use and forestry sectors (310 MtCO2e). If that wasn’t bad enough, it could cause the loss of 3.86 million species abundance (on top of existing outsourcing of extinction footprints). All of this will undermine the gains from the EGD’s policies on deforestation-free imports and biofuels. Such resource drains and environmental strains that high-income countries outsource to the rest of the world are part of a long (neo-)colonial history of ecological unequal exchange.

Source: Zhong, H., Li, Y., Ding, J., Bruckner, B., Feng, K., Sun, L., … & Hubacek, K. (2024). Global spillover effects of the European Green Deal and plausible mitigation options. Nature Sustainability, 1-11.

Drained and underpaid

Capitalism’s ecologically destructive path fuels inequality in who bears the brunt of resource extraction, environmental damage, and blame. Research on Ecological Unequal Exchange (EUE) has highlighted this issue. But why exactly is EUE unequal? First, the system’s relentless demand for resources by wealthy regions leaves the rest deprived, turning EUE into an environmental zero-sum game. Second, the local environmental damage caused by extraction is unfairly concentrated in specific areas, deepening the inequality. Third, the global South is not just drained of natural resources but also underpaid, reinforcing long-term uneven development. We can illustrate this by measuring the average monetary compensation per resource exported. Specifically, we divide the Trade in Value Added (TiVA, i.e., value added by all production steps within a country) in exports by the resources used in those exports. For example, one study shows that high-income countries capture 11 times greater compensation per ton of raw material in exports compared to low-income countries. The graphs shared here support this by plotting per capita net imports of resources against TiVA per resource exported, demonstrating that the more a country is drained of resources through trade, the more underpaid it tends to be in the process.

Source: Olk, C. (2024). How much a dollar cost: Currency hierarchy as a driver of ecologically unequal exchange. World Development, 180, 106649.

Global North Must Slash Resource Hoarding by 70%

In 2015, global production systems used 90 billion tonnes (Bt/yr). High-income countries are the biggest over-users, hoarding metals, fossil fuels, and biomass through trade with the rest of the world. Between 1970 and 2017, they drove 74% of global resource overshoot, with the US alone responsible for 27%, and wealthier EU nations adding 25%. Meanwhile, China contributed 15%, and the entire Global South—Africa, Latin America, and Asia—just 8%. The high-income countries have far exceeded their “fair share”, blowing past the sustainable limit of 50 billion tonnes per year (Bt/yr) since 1997. To prevent more damage, they must cut consumption by 70%, from 32.7 Bt/yr to 8.1 Bt/yr. They owe this to the planet and to the countries that have contributed the least to the environmental crisis. Low-income countries, which use only 1.8 Bt/yr, can increase to 5.1 Bt/yr for a fair share.

Sources: Bringezu, S. (2015). Possible target corridor for sustainable use of global material resources. Resources, 4(1), 25-54; Hickel, J., O’Neill, D. W., Fanning, A. L., & Zoomkawala, H. (2022). National responsibility for ecological breakdown: a fair-shares assessment of resource use, 1970–2017. The Lancet Planetary Health, 6(4), e342-e349; Image: University of Leeds. (2024). National Responsibility for Ecological Breakdown. A Good Life For All Within Planetary Boundaries.

Global trade’s extinction footprint

Biodiversity, crucial for sustaining ecosystems that support human life, is under serious threat, largely due to human activities. Habitat destruction and climate change are major factors, often driven by consumption in distant countries. This study tracks extinction-risk footprints for 188 nations, showing which countries’ consumption impacts species the most—whether from imported, exported, or domestic sources. The map highlights that 76 countries, mainly in Europe, North America, and East Asia, are net importers of extinction risk (orange). In net exporters (green), the risk is driven by consumption abroad, while domestic consumption dominates in others (blue). Global trade accounts for 29.5% of the overall extinction-risk footprint.

Source: Irwin, A., Geschke, A., Brooks, T. M., Siikamaki, J., Mair, L., & Strassburg, B. B. (2022). Quantifying and categorising national extinction-risk footprints. Scientific reports, 12(1), 5861.

Wealthy nations outsource their land use

Land use is becoming more globalised, easing pressure on local ecosystems in some areas but raising pressures elsewhere. This study finds that wealthier countries rely less on local and more on imported resources, using the concept of “embodied human appropriation of net primary production” (eHANPP), which tracks how much of the natural inflow of energy and biomass into the biosphere (NPP) humans appropriate through the harvesting or burning biomass and converting natural ecosystems to managed lands. The study identifies five land-use clusters: exporters, outsourcers, intensifiers, intermediates, and the self-sufficient. Exporters like Australia and Canada lead in per capita eHANPP exports, while self-sufficient nations in Africa and Asia rely heavily on local resources. Intensifiers have high energy and material use per biomass unit. Outsourcers, mainly wealthy European countries, depend on eHANPP net-imports, using 43% of their own NPP and importing similar amounts, while consuming four to five times more energy and materials than the global average.

Source: Dorninger, C., von Wehrden, H., Krausmann, F., Bruckner, M., Feng, K., Hubacek, K., … & Abson, D. J. (2021). The effect of industrialization and globalization on domestic land-use: A global resource footprint perspective. Global Environmental Change, 69, 102311.