The Global Structure of Dependency

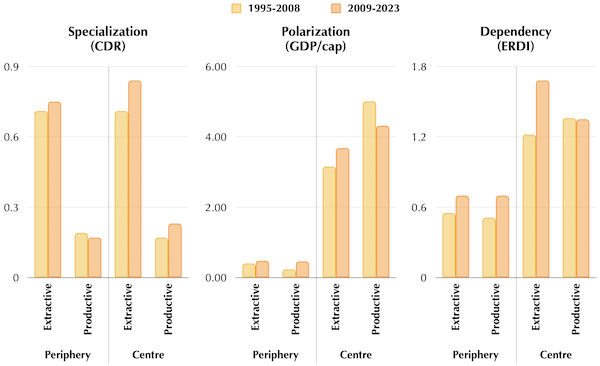
This graph classifies countries into centre (above-average GDP per capita) and periphery (below-average), then further into productive or extractive based on their commodity dependence ratio (CDR): those with over 60% of exports in primary goods are extractive; the rest, productive. It also tracks two structural imbalances—polarisation, via normalised GDP per capita, and dependency, via the Exchange Rate Deviation Index (ERDI), which measures divergence between market exchange rates and purchasing power parity (PPP). Covering 1995–2008 and 2009–2023, the data reveals three key trends: the productive centre’s share of global manufacturing exports shrinks while the productive periphery grows, reflecting offshoring and centre deindustrialisation; industrial growth in the periphery has not closed the income gap, challenging the idea that industrialisation leads to convergence; and persistent currency undervaluation in the periphery entrenches unequal terms of trade.

Based on: Ricci, A. (2025). Global Structure of Dependency and Socio-ecological Crisis: Intersecting Delinking and Degrowth for an Ecosocialist Transition. Capitalism Nature Socialism, 36(2), 1–21.

The Extraction-Consumption Inversion

From 1970 to 2024, global resource extraction surged from 31 to 106 gigatons, with about 30 percent consistently tied to traded goods. This growth is marked by stark inequalities and a zero-sum dynamic: more resources flowing to high-income countries means fewer for low-income ones. Based on data tracking traded raw materials and their embodiment as Raw Material Equivalents (RMEs) in (semi-)finished products, the group of high-income countries is the only one with cumulative net imports, totalling 290 Gt. All other income groups were net exporters, with low-income countries collectively exporting 9.6 Gt. The graph here adds an important nuance: while their exports are the smallest in absolute terms, the drain is significant relative to what they extract. As a group, low-income countries consumed 13.3 percent less than they extracted, sending the rest to global markets. Meanwhile, high-income countries consumed 24.1 percent more than they extracted, bridging the gap with imports.

Source: Rammelt, C., & Ylla-Catala, R. C. (2025). Ecological Unequal Exchange: Winners and Losers in Global Raw Material Trade and Consumption. Journal of World-Systems Research, 31(1), 341–372.