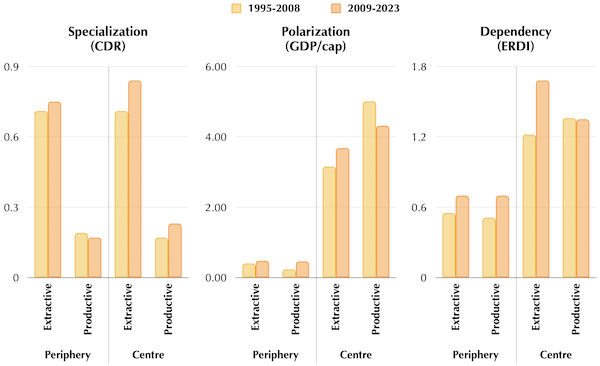
The Global Structure of Dependency
This graph classifies countries into centre (above-average GDP per capita) and periphery (below-average), then further into productive or extractive based on their commodity dependence ratio (CDR): those with over 60% of exports in primary goods are extractive; the rest, productive. It also tracks two structural imbalances—polarisation, via normalised GDP per capita, and dependency, via the Exchange Rate Deviation Index (ERDI), which measures divergence between market exchange rates and purchasing power parity (PPP). Covering 1995–2008 and 2009–2023, the data reveals three key trends: the productive centre’s share of global manufacturing exports shrinks while the productive periphery grows, reflecting offshoring and centre deindustrialisation; industrial growth in the periphery has not closed the income gap, challenging the idea that industrialisation leads to convergence; and persistent currency undervaluation in the periphery entrenches unequal terms of trade.

