
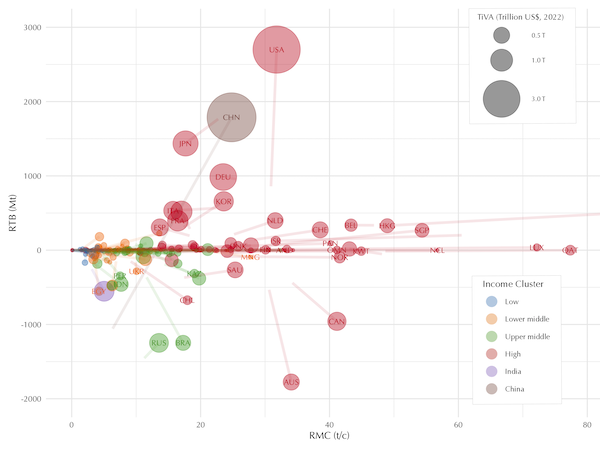
Winners and Losers in Raw Material Trade
This graph illustrates ecological unequal exchange—a theory that challenges the idea that trade benefits all. Instead, it shows how global trade deepens injustices through uneven resource flows. On the y-axis: Raw Material Trade Balances (RTB). A positive RTB means a country is a net importer of embodied raw materials (used anywhere along the supply chain). A negative RTB means it’s a net exporter. Colours indicates income levels, and the pattern is clear: wealthy nations dominate the importing side draining resources from the rest of the world, with notable outliers like Australia and Canada, which export more than they import. The x-axis shows per capita Raw Material Consumption. Lower-income countries cluster on the left, consuming far less per person. Trend lines from 1992 to 2022 show rising global consumption—especially among wealthier nations. But China stands out: once a major exporter, it now imports more than it exports and is rapidly approaching U.S. consumption levels. The bubble size reflects 2022 Domestic Value Added—the total value captured from trade. The U.S. and China lead, each capturing over $3 trillion. A grim pattern emerges: the farther a country is from trade balance (RTB = 0), the larger the bubble. In other words, the more a country exploits the environment, whether abroad (e.g., U.S., China, Japan, Germany) or domestically (e.g., Australia, Canada, Russia, Brazil), the more it earns.