Five Netherlands

The Netherlands has a significant land-use footprint, primarily driven by imports. Despite the country’s total surface area of 4.2 million hectares, which includes inland and open water, only 2.0 million hectares are dedicated to arable land, permanent crops, and pastures for agricultural and forestry activities. However, the Netherlands supplements its limited domestic land with a staggering 20.3 million hectares of imported land use. When taking exports into consideration, the net trade land-use expands to 18.8 million hectares. Overall, the Netherlands’ total land-use footprint reaches 20.8 million hectares, which is more than five times its own surface area! This extensive footprint illustrates the heavy reliance of the Netherlands on international land resources to sustain its economy and population, surpassing the capacity of its own land.

Data source: UNEP (2024). SCP-HAT database v3.0. UN Life Cycle Initiative, UN One Planet Network, UN International Resource Panel. Paris. https://scp-hat.org/methods

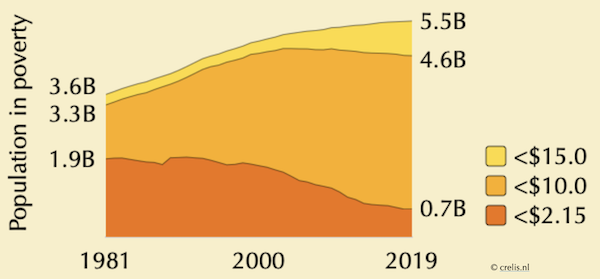
A ridiculously low poverty line

It’s easy to feel reassured by the narrative that global poverty is shrinking, especially when we hear, e.g., that the number of people living on $2.15 a day dropped from nearly 2 billion in 1981 to 702 million in 2019. But let’s be real—surviving on $2.15 a day is a far cry from actually living. A healthy diet alone requires about $6.9 per day, and some argue that an escape from poverty happens closer to $10 or even $15 daily. At those levels, the picture is far more alarming, with billions still trapped in poverty, despite the so-called progress of global capitalism. It’s time to stop celebrating superficial victories and start addressing the real needs of people around the world.

Data source: World Bank (2024), Poverty and Inequality Platform (version 20230919_2017_01_02_PROD) [data set]. pip.worldbank.org. Accessed on 2024-02-23

The feeble decoupling of emissions from growth

Recent self-congratulatory absolute decoupling of emission from economic growth in high-income countries falls far short of meeting their fair share of the 1.5°C global carbon budget. The graph below shows actual data and future scenarios for consumption-based CO2 emissions (as percentages of 2022 levels) for 11 high-income countries that have achieved absolute decoupling, along with their population-weighted average. Dark grey lines represent data from the decoupling period (2013-2019), while light grey lines cover the recession and rebound period (2020-2022). Dashed red lines project future emissions under a continuation of the 2013-2019 GDP growth and decoupling rates (business as usual), while dashed blue lines depict emissions pathways that would keep these countries within their fair share of the global carbon budget, offering a 50% chance of limiting warming to 1.5°C (not great odds, but let’s go with it). Conclusions? At current rates, these countries would take over 200 years to approach zero emissions, emitting more than 27 times their fair share of the carbon budget! To meet the 1.5°C target while maintaining economic growth, decoupling rates would need to increase tenfold by 2025. Hypothetically, if these countries manage such an energy transition (against the odds), the world would quickly run up against mineral resource limits, leaving other countries without the resources needed for their own transition. Growth is the problem.

Source: Vogel, J., & Hickel, J. (2023). Is green growth happening? An empirical analysis of achieved versus Paris-compliant CO2–GDP decoupling in high-income countries. The Lancet Planetary Health, 7(9), e759-e769.

A homework assignment for “green growthers”

Green growth proponents continue to produce flawed graphs that claim to show the decoupling of emissions from economic growth. These graphs are repeatedly critiqued, but the critiques are ignored, leading to a cycle of misleading representations. The latest iteration, now circulating on Dutch social media, is no different (see bottom-right graph). Instead of repeatedly doing their homework for them (again and again and again), let’s give green growth advocates a clear assignment: create a graph for the Netherlands—or better yet, for multiple high-income countries—that accurately compares emissions to economic growth (or even better, compares growth to various pollution flows and material resource uses). This graph should reflect historical and consumption-based data (so first, learn what this means), include all sources of environmental impact (don’t forget land use, air, and freight transportation), and ensure data transparency. It should also compare the results with global targets and fair-share responsibilities. Your grade will depend on how far back your data goes, the completeness of your sources, the range of material pressures included, and your engagement with the latest scientific literature.